In my training as a statistician, we talked a great deal about sufficient statistics. While the mathematics is complex, the concept is quite simple: a statistic is sufficient if it gives just as much information as the sample itself (i.e. there was no loss of information). For example, if one can tolerate the assumption of a normal (bell-shaped) distribution, we can reduce a hundred observations to three numbers: the sample size, the mean, and the standard deviation. Instead of considering 100 numbers, I can consider three numbers without losing anything. Such a dimensional reduction is the bedrock of the statistical method, as we strive to reduce a large sample to a few summary stats.
Returning to the subject at hand, let's say we're interested in how often a batter is walked (not beaned) in baseball. If we assume this distribution is binomial in nature (i.e. there's some constant probability of walking for this particular batter), we can use the number of plate appearances (PA) and the bases on balls (BB) to estimate the probability of a 4 ball walk (BB/PA). So BB and PA together contain all the information that we could glean from the play-by-play and are therefore sufficient statistics in this scenario.
What about the more complicated scenario of batter hitting tendencies? We might assume that there is a multinomial distribution governing a player's chance of hitting to the various bases. Again, we can estimate the respective probabilities governing this distribution by looking at all at-bats (AB) of this batter and compared to the number of singles, doubles (2B), triples (3B), and home-runs (HR). Though singles are not recorded individuals, they are included in total hits (H), so the number of singles can be computed by complement logic (S = H - 2B - 3B - HR). So we see these statistics are sufficient for the theoretical base distribution of any particular hitter.
Let's now shift our focus to an insufficient statistic in baseball: RBIs or Runs-Batted-In. The RBI attempts to capture the contribution of the hitter to driving base-runners home, but we don't know if players were batted in from 1st, 2nd, or 3rd. So there is more information in the play-by-play (the sample) than is contained in the statistic (RBI), ergo this is an insufficient statistic. To improve RBIs to a sufficient statistic, one might split it into three sub-categories (respectively RB1, RB2, RB3).
Now if tracking runs batted in is important then surely we would care if a player advances a base-runner into scoring position. However, with the exception of stolen bases, the movements of base-runners is completely ignored by traditional baseball stats (surely some MLB Analytics sites track this, comment below if you know of one). So we might add some statistics like first-to-second (1T2) and first-to-third (1T3) and for the sake of completeness second-to-third (2T3).
Logging base-runner movements with the addition of these six statistics would go a long way in capturing the value a hitter brings to the team in terms of advancing bases. Similar logic might be applied to stolen bases, as it would be nice to know if runners were successful or caught stealing from 1st to 2nd, 2nd to 3rd, or even 3rd to home. I'm hoping to finish a demo of this data (restricted to the American League Games) to illustrate the potential value of these statistics by opening day, so follow or bookmark this blog and check it out early next week.

Wednesday, March 30, 2016
Tuesday, March 29, 2016
Jared Cook - Catch rates
It seemed like a post was in order to bring the Jared Cook hype train back to earth (it was going so fast that it achieved escape velocity). Sure, Jared Cook has had 6 different quarterbacks over the last 3 years with the Rams, but let's actually see some number before we conclude that poor quarterback play has been holding Cook back:

With the QB's career completion rate on the x-axis as a point of reference, the plotted point estimate (with 95% confidence intervals ) is Cook's catch rate under the listed quarterback in every game that this QB played exclusively. In order to get this posted in a reasonable time frame, I excluded games with multiple QBs as that would have required I dig into all the play-by-play data. The reader is welcome to look into those games to see if they drastically change the numbers listed here:
Still, for the purpose of being thorough, we might also want to compare Cook's aggregate catch rate with all other Rams pass-catchers over the last 3 years:
We see that Cook's catch rate (142/259 = 54.8%) is quite a bit lower than other Rams (628/1021 = 61.5%). One can apply a Chi-square test to see if this difference is large enough to be systematically different or if it may just be a chance driven and find the p-value was marginally significant (p < .10). Note that Cook's NFL catch rate with the Rams is not significantly better (p=0.721) than his college rate (71/140).
While I suppose it's possible that all these numbers are simply reflective of the fact that QB chemistry is more important for the the tight-end positions than other pass catchers, but these numbers make me think that Jared Cook is not destined to have a break-out year, even if it is Aaron Rodgers is throwing him the ball.
With the QB's career completion rate on the x-axis as a point of reference, the plotted point estimate (with 95% confidence intervals ) is Cook's catch rate under the listed quarterback in every game that this QB played exclusively. In order to get this posted in a reasonable time frame, I excluded games with multiple QBs as that would have required I dig into all the play-by-play data. The reader is welcome to look into those games to see if they drastically change the numbers listed here:
| QB | Passes | Catches |
| Bradford | 37 | 22 |
| Clemens | 41 | 25 |
| Hill | 42 | 21 |
| Davis | 43 | 25 |
| Foles | 53 | 27 |
| Keenum | 19 | 10 |
Still, for the purpose of being thorough, we might also want to compare Cook's aggregate catch rate with all other Rams pass-catchers over the last 3 years:
| Passes | Catches | |
| Rams | 1494 | 901 |
| Cook | 259 | 142 |
| Not Cook | 1021 | 628 |
We see that Cook's catch rate (142/259 = 54.8%) is quite a bit lower than other Rams (628/1021 = 61.5%). One can apply a Chi-square test to see if this difference is large enough to be systematically different or if it may just be a chance driven and find the p-value was marginally significant (p < .10). Note that Cook's NFL catch rate with the Rams is not significantly better (p=0.721) than his college rate (71/140).
While I suppose it's possible that all these numbers are simply reflective of the fact that QB chemistry is more important for the the tight-end positions than other pass catchers, but these numbers make me think that Jared Cook is not destined to have a break-out year, even if it is Aaron Rodgers is throwing him the ball.
Saturday, March 26, 2016
Short Yardage Conversion Rates: 2009-2015
Thanks to football outsiders' Scott Kacsmar, we have some data for NFL conversion rates over the last 7 years. While looking at these rate alone is helpful and allows Scott to draw the reasonable conclusion passing is a bad yet popular choice in short yardage situation, we might benefit from being able to visualize the variance on these estimates. To this end, I constructed the Wald 95% confidence intervals for each of those estimates by year:
First let's look at the one-yard-to-go situation, broken down by down and type of play:

With the exception of the suspiciously low non-QB run rate in 2011 (p = 0.001 compared to neighboring years), we can clearly see that running has been better than passing over the past 7 years of historical data in one-yard-to-go situations. What about two yards to go, you ask? Here are the comparable charts with the run data aggregated for 4th and 2 (the sample was too small otherwise):

The size of the confidence intervals illustrate that teams are passing more often than running in 3rd and 2 situations. We see a similar trend in the 4th and 2 situations.
Just looking at this data, it's tempting to conclude that we should always go with a QB run, but I doubt one can really compare QB runs and non-QB runs without being able to differentiate between a full yard to go and merely inches. The problem is that we may be comparing apples and oranges if QB sneaks are more likely in the inches situation, as those would be more likely to convert. This is a bit of a soapbox issue for me as researchers (in medicine and sports) will often do a retrospective analysis and erroneously conclude a causal relationship, when it may merely be a correlative one.
Thursday, March 24, 2016
RGIII to Josh Gordon
When I read the news that Robert Griffin III was heading to Cleveland, after saying a quick prayer for Josh Gordon's reinstatement, my next thought was, "Baylor Bears Reunion!" As you may remember, Griffin and Gordon played together for 4 glorious games in 2004 before Gordon's off the field issues got in the way. Granted, 4 games is a pretty small sample, but the span of plays between the two included multiple touchdowns, first downs, fumbles, and even a trick play, so I compiled some numbers as taken from old play-by-play data (detailed below for the record):

RGIII to J.Gordon in 2010:
| Targets | 29 |
| Completions | 19 |
| Total Yards | 429 |
| Completion % | 65.5% |
| Yards per Target | 9.1 |
| Yards per Catch | 22.6 |
| 1st downs | 9 |
| Touchdowns | 5 |
At 22.6 yards per catch, it shouldn't be terribly surprising that nearly half of these plays (48%) were for either a touchdown or a first down, as illustrated below:
Now there are certainly questions as to whether these two players can return to form after their respective falls from grace, but looking at the numbers, it seems like there is some chemistry to be rediscovered if they can.
THE DATA:
| October 2nd vs. Kansas |
| 1st and 10 at KU 39 |
| (12:52 - 1st) Robert Griffin III pass complete to Josh Gordon for 39 yards for a TOUCHDOWN. |
| 1st and 10 at BAY 6 |
| (4:09 - 2nd) Robert Griffin III pass complete to Josh Gordon for 94 yards for a TOUCHDOWN. |
| 1st and 10 at BAY 46 |
| (2:27 - 2nd) Robert Griffin III pass complete to Josh Gordon for 21 yards to the Kans 33, tackled by Lubbock Smith for a 1ST down. |
| 2nd and 10 at BAY 25 |
| (9:43 - 3rd) Robert Griffin III pass complete to Josh Gordon for 7 yards to the Bayl 32, tackled by Isiah Barfield. |
October 9th at TTU |
| 2nd and 8 at TTU 34 |
| (11:52 - 2nd) Robert Griffin III pass complete to Josh Gordon for 34 yards for a TOUCHDOWN. |
| 2nd and 7 at BAY 27 |
| (10:10 - 2nd) Robert Griffin III pass incomplete to Josh Gordon. |
| 1st and 10 at BAY 34 |
| (6:24 - 2nd) Robert Griffin III pass incomplete to Josh Gordon. |
| 1st and 10 at TTU 47 |
| (6:22 - 3rd) Robert Griffin III pass incomplete to Josh Gordon. |
| 2nd and 17 at BAY 10 |
| (11:34 - 4th) Robert Griffin III pass complete to Josh Gordon for 27 yards to the Bayl 37 for a 1ST down. |
| 3rd and 7 at BAY 40 |
| (10:52 - 4th) Robert Griffin III pass incomplete to Josh Gordon. |
| 3rd and 7 at BAY 36 |
| (7:55 - 4th) Robert Griffin III pass complete to Josh Gordon for 20 yards to the TexTc 44 for a 1ST down. |
| 1st and 10 at TTU 16 |
| (5:11 - 4th) Robert Griffin III pass complete to Josh Gordon for a loss of 1 yard to the TexTc 17. |
| 4th and 15 at TTU 21 |
| (3:47 - 4th) Josh Gordon pass complete to Robert Griffin III for 9 yards to the TexTc 12. |
| 2nd and 10 at TTU 47 |
| (0:00 - 4th) Robert Griffin III pass complete to Josh Gordon for 16 yards to the TexTc 31 for a 1ST down. |
October 23rd at Kansas State |
| 3rd and 8 at KSU 28 |
| (11:52 - 1st) Robert Griffin III pass complete to Josh Gordon for 28 yards for a TOUCHDOWN. |
| 1st and 10 at BAY 36 |
| (11:26 - 2nd) Robert Griffin III pass incomplete to Josh Gordon, broken up by David Garrett. |
| 1st and 10 at KSU 47 |
| (4:17 - 2nd) Robert Griffin III pass complete to Josh Gordon for 47 yards for a TOUCHDOWN. |
| 1st and 10 at KSU 25 |
| (2:38 - 2nd) Robert Griffin III pass complete to Josh Gordon for 16 yards to the KanSt 24, tackled by Stephen Harrison, BAYLOR penalty 15 yard unsportsmanlike conduct on Josh Gordon accepted. |
| 1st and Goal at KSU 5 |
| (0:22 - 2nd) Robert Griffin III pass incomplete to Josh Gordon, broken up by Stephen Harrison. |
| 2nd and Goal at KSU 5 |
| (0:22 - 2nd) Robert Griffin III pass incomplete to Josh Gordon. |
| 1st and 10 at BAY 31 |
| (10:16 - 3rd) Robert Griffin III pass complete to Josh Gordon for 17 yards to the Bayl 48, tackled by Stephen Harrison out-of-bounds for a 1ST down. |
| 1st and 10 at BAY 48 |
| (10:16 - 3rd) Robert Griffin III pass complete to Josh Gordon for 14 yards to the KanSt 38, tackled by Emmanuel Lamur for a 1ST down. |
| 2nd and 7 at BAY 47 |
| (2:17 - 3rd) Robert Griffin III pass complete to Josh Gordon for 10 yards to the KanSt 43, tackled by Stephen Harrison for a 1ST down. |
| 2nd and 15 at BAY 40 |
| (14:36 - 4th) Robert Griffin III pass complete to Josh Gordon for 9 yards to the Bayl 49, tackled by Emmanuel Lamur out-of-bounds. |
| 3rd and 6 at BAY 49 |
| (14:36 - 4th) Robert Griffin III pass incomplete to Josh Gordon. |
November 6th vs. Oklahoma State |
| 1st and 10 at BAY 9 |
| (14:50 - 1st) Robert Griffin III pass complete to Josh Gordon for 15 yards to the Bayl 24 for a 1ST down. |
| 2nd and 1 at BAY 33 |
| (14:30 - 1st) Robert Griffin III pass complete to Josh Gordon for 12 yards to the Bayl 45 for a 1ST down. |
| 2nd and 6 at BAY 35 |
| (6:15 - 1st) Robert Griffin III pass complete to Josh Gordon for 4 yards, fumbled, forced by Brodrick Brown, recovered by OKSt Brodrick Brown at the Bayl 37. |
| 1st and 10 at BAY 45 |
| (0:33 - 1st) Robert Griffin III pass incomplete to Josh Gordon, broken up by Brodrick Brown. |
| 3rd and 15 at BAY 40 |
| (0:20 - 1st) Robert Griffin III pass incomplete to Josh Gordon, BAYLOR penalty Pass Interference on Josh Gordon declined. |
Wednesday, March 23, 2016
Hunter Henry is not (yet) Jason Witten
Ok, I know everyone loves comparing a potential NFL recruit to a time-tested one. I get the comparisons between Jason Witten and Hunter Henry. They were both durable, both SEC tight ends, and both had very similar combine/pro-day numbers.
The trouble is their size: Witten was an inch taller and 15 lbs heavier than Henry. That's a big difference in weight! According to the statistical model used in predicting tight-end pro-bowl status (recently featured on FootballOutsiders), Henry is unlikely to earn the honor at his current weight:
The trouble is their size: Witten was an inch taller and 15 lbs heavier than Henry. That's a big difference in weight! According to the statistical model used in predicting tight-end pro-bowl status (recently featured on FootballOutsiders), Henry is unlikely to earn the honor at his current weight:
| Name | Hgt | Wgt | Dash | Vert | Hgt+Vert | Wgt/Dash | P(ProBowl) |
| Hunter Henry | 77 | 250 | 4.67 | 31.5 | 108.5 | 53.5 | 2.1% |
| Jason Witten | 78 | 264 | 4.65 | 31 | 109 | 56.8 | 11.8% |
According to the retrospective analysis of combine tight ends from 1999-2011 that was conducted previously, 6% probability is the optimal number for predicting pro-bowl appearance. This 6% was somewhat validated in the cohort of 2011-2013 tight-end combine participants, with Kelce (12.8%) and Eifert (6.6%) both making pro-bowls recently.
Modifying Henry's weight suggest he would need to put on 10 lbs (preferably of muscle to avoid sacrificing his 40 time or vertical leap) to achieve this 6% according to the aforementioned model. This isn't saying Henry can't be a pro-bowl tight end, I'm just saying he still may have some work in the weight room before he has the mass required to compete in the NFL as a tight-end.
Monday, March 21, 2016
TAMU over N.Iowa in Overtime!
Even as one of the proudest members of the Fighting Texas Aggie Class of 2004, I have become accustomed to losing. If you followed Aggie Sports from 2000-2004, you know what I mean. I still have faith in our boys, but giving up on Texas A&M when they were trailing Northern Iowa by 12 with 44 seconds left in the fight for a Sweet 16 berth was nothing unusual for me. However, what followed in the last 44 seconds was beyond unusual: here's a screenshot courtesy of the guys over at fivethirtyeight.com, that I borrowed from the CBS summary of the game.
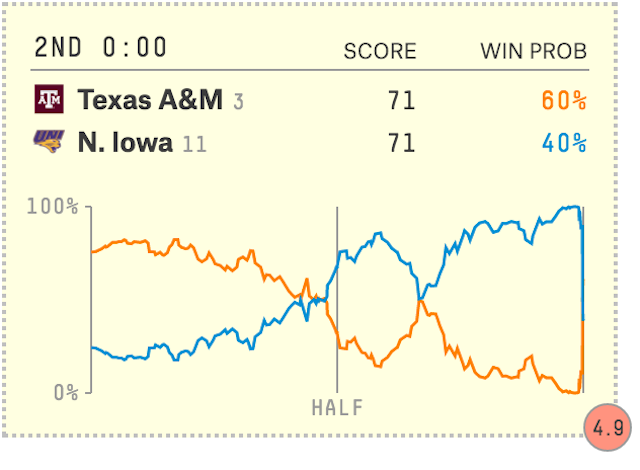
Writers often describe such comebacks as "Miraculous", and they were quick to do so again here. Such events are so improbable that they surely do seem impossible. But how many times, upon seeing a particularly spectacular comeback, have you rhetorically waxed: "Holy shit, what are the odds?" Well, it's difficult to say with certainty in extreme cases, but let's assume the worst case of estimates I've seen: 99.99% for N.Iowa or a 0.01% chance of victory for the Aggies*. So, perhaps it's roughly 1:10000, or a one in 10000 chance. Yet, through a series of unlikely events, a comeback happened. And as an Aggie Fan, I thank God it did.
While I am a spiritual person (even when not watching sports), I know as a mathematician that observing such a comeback is not as miraculous as one might think. Seeing such a comeback in the NCAA tournament is an inherent part of the wonderful misery that is "March Madness". There are entire books on the topic, but let me attempt to convince you that observing a 1:10000 chance in the history of the NCAA tournament is more probable than you might think.
The magic (or miracle) is in the law of large numbers. By the end of this year, there will have been a lot of NCAA tournament games. By complement logic (Total teams - Total Champs), I believe there will be 3048 games played since 1939. That's a lot of games! A one in 5000 chance corresponds to 0.0001 probability. According to the solution to this standard probability problem, the probability that a 1:10000 comeback like this NEVER happens from 1939 through 2016 would be 73.7%, so the odds of at least one would be 26.3%, better than a 1 in 4 chance! However, the fact that it happened to my Texas Aggies still feels like a wink from God.
*Note: If instead go with Ken Pomeroy's models, his 0.03% chance or 1:3333 corresponds to a 40% chance of observing such an improbable outcome at least once in NCAA tournament history.
NCAA 2016: Sweet 16 projections
Using the Pythagorean Win % statistic from Ken Pomeroy's site, I've estimated the probability of victory for each sweet 16 team advancing further into the tournament:
| Team | Pyth | Elite 8 | Final 4 | Finals | Champs |
| Kansas 1 | 0.9503 | 73.6% | 45.2% | 30.0% | 18.2% |
| Maryland 5 | 0.8725 | 26.4% | 9.6% | 4.0% | 1.5% |
| Miami FL 3 | 0.8971 | 37.7% | 14.2% | 6.8% | 2.9% |
| Villanova 2 | 0.9352 | 62.3% | 30.9% | 18.5% | 10.0% |
| Oregon 1 | 0.9123 | 59.7% | 30.4% | 12.9% | 6.0% |
| Duke 4 | 0.8752 | 40.3% | 16.6% | 5.6% | 2.1% |
| Texas A&M 3 | 0.8923 | 41.9% | 20.2% | 7.5% | 3.1% |
| Oklahoma 2 | 0.9199 | 58.1% | 32.7% | 14.7% | 7.1% |
| North Carolina 1 | 0.9407 | 64.8% | 49.7% | 28.8% | 16.0% |
| Indiana 5 | 0.8959 | 35.2% | 22.6% | 9.9% | 4.0% |
| Notre Dame 6 | 0.8131 | 45.5% | 11.7% | 3.4% | 0.9% |
| Wisconsin 7 | 0.839 | 54.5% | 16.0% | 5.2% | 1.6% |
| Virginia 1 | 0.9482 | 68.9% | 53.3% | 34.0% | 20.1% |
| Iowa St. 4 | 0.8919 | 31.1% | 18.9% | 8.6% | 3.4% |
| Gonzaga 11 | 0.8609 | 59.0% | 18.1% | 7.1% | 2.4% |
| Syracuse 10 | 0.8111 | 41.0% | 9.7% | 3.0% | 0.8% |
However, as George Box observed, "all models are wrong, some are useful", so maybe it's more meaningful to look at how these probabilities rank:
| Team/Seed | Conference | Pyth | Champs |
| Virginia 1 | ACC | 0.9482 | 20.1% |
| Kansas 1 | B12 | 0.9503 | 18.2% |
| North Carolina 1 | ACC | 0.9407 | 16.0% |
| Villanova 2 | BE | 0.9352 | 10.0% |
| Oklahoma 2 | B12 | 0.9199 | 7.1% |
| Oregon 1 | P12 | 0.9123 | 6.0% |
| Indiana 5 | B10 | 0.8959 | 4.0% |
| Iowa St. 4 | B12 | 0.8919 | 3.4% |
| Texas A&M 3 | SEC | 0.8923 | 3.1% |
| Miami FL 3 | ACC | 0.8971 | 2.9% |
| Gonzaga 11 | WCC | 0.8609 | 2.4% |
| Duke 4 | ACC | 0.8752 | 2.1% |
| Wisconsin 7 | B10 | 0.839 | 1.6% |
| Maryland 5 | B10 | 0.8725 | 1.5% |
| Notre Dame 6 | ACC | 0.8131 | 0.9% |
| Syracuse 10 | ACC | 0.8111 | 0.8% |
With the record number of ACC teams, it might be interesting to compute the probability of an ACC champ. I've been using a lot of complement logic lately, so may as well stick with the trend:
P(no ACC win) = (1-.201)*(1-.160)*(1-.029)*(1-.021)*(1-.009)*(1-.008) = 0.628
Therefore, P(ACC win) = 1 - P(no ACC win) = 1 - 0.628 = 0.372.
So Ken Pomeroy's model of win % estimates the probability of an ACC champ at 37.2%, where most of that probability is wrapped up in either Virginia or North Carolina (32.8% to be exact).
Saturday, March 19, 2016
Exploring the effect of size on NFL combine drills: Offensive (skill) positions
Just as we did with defensive positions, let's explore the relationship between size and speed within the combine drills by positions, from smallest/fastest to largest/slowest. Again, we transformed all timed events using the rate (total distance/time taken) to ensure larger numbers are better in all drills. The data is was combine participants between 1999 and 2015.
Let's start in the backfield (quarterbacks excluded, as the possible subject of a future post):

There doesn't appear to be much happening with respect to height, though there appear to be some strong relationships with weight. Again, we'll examine the partial correlation coefficients (adjusted for position differences between RB/FB) along with the p-values for the test for significant, non-zero partial correlation between these drills and weight/height:
Indeed, all the rates appear strongly inversely proportional to weight. We see a similar trend in bench press that was observed in the secondary: larger weight (likely in muscle) corresponds to better bench press reps. Also, we see a similar trend in broad jump that was observed in the linebackers with a small weight penalty and slight height advantage. Shuttle rates are somewhat inversely proportional to height, but this may be because taller individuals tend to weigh more.
Moving onto the receivers, we see some similar trends to that observed in the backs:

Again, the rates are strongly inversely correlated to the weight and somewhat positively correlated with height, again likely due to the tendency for height and weight to co-correlate. Again, we see being taller is advantageous for broad jump, and we also see that weight (muscle?) is an advantage for bench press.
Finally, let's look at the offensive linemen:

Let's start in the backfield (quarterbacks excluded, as the possible subject of a future post):
There doesn't appear to be much happening with respect to height, though there appear to be some strong relationships with weight. Again, we'll examine the partial correlation coefficients (adjusted for position differences between RB/FB) along with the p-values for the test for significant, non-zero partial correlation between these drills and weight/height:
Pearson Partial Correlation Coefficients, N = 301
Prob > |r| under H0: Partial Rho=0 |
||||||
dash_rate
|
shuttle_rate
|
cone_rate
|
VertLeap
|
BroadJump
|
BenchPress
|
|
Weight
|
-0.24607
<.0001 |
-0.32696
<.0001 |
-0.27348
<.0001 |
-0.06997
0.2269 |
-0.11010
0.0568 |
0.17279
0.0027 |
Height
|
-0.06765
0.2427 |
-0.14032
0.0150 |
-0.06441
0.2661 |
0.10126
0.0799 |
0.10990
0.0573 |
-0.06758
0.2433 |
Moving onto the receivers, we see some similar trends to that observed in the backs:
Pearson Partial Correlation Coefficients, N = 361
Prob > |r| under H0: Partial Rho=0 |
||||||
dash_rate
|
shuttle_rate
|
cone_rate
|
VertLeap
|
BroadJump
|
BenchPress
|
|
Weight
|
-0.26015
<.0001 |
-0.20277
0.0001 |
-0.25864
<.0001 |
-0.08922
0.0910 |
0.00048
0.9927 |
0.21709
<.0001 |
Height
|
-0.11617
0.0275 |
-0.17604
0.0008 |
-0.10181
0.0536 |
-0.04737
0.3702 |
0.11930
0.0236 |
-0.00177
0.9732 |
Again, the rates are strongly inversely correlated to the weight and somewhat positively correlated with height, again likely due to the tendency for height and weight to co-correlate. Again, we see being taller is advantageous for broad jump, and we also see that weight (muscle?) is an advantage for bench press.
Finally, let's look at the offensive linemen:
The regression lines are so similar that it may not be necessary to adjust for outside/inside position, but it couldn't hurt. In all likelihood, the partial correlation coefficients below are identical to the standard correlation coefficients if we just pooled all the offensive linemen together.
Pearson Partial Correlation Coefficients, N = 361
Prob > |r| under H0: Partial Rho=0 |
||||||
dash_rate
|
shuttle_rate
|
cone_rate
|
VertLeap
|
BroadJump
|
BenchPress
|
|
Weight
|
-0.26015
<.0001 |
-0.20277
0.0001 |
-0.25864
<.0001 |
-0.08922
0.0910 |
0.00048
0.9927 |
0.21709
<.0001 |
Height
|
-0.11617
0.0275 |
-0.17604
0.0008 |
-0.10181
0.0536 |
-0.04737
0.3702 |
0.11930
0.0236 |
-0.00177
0.9732 |
Much of the same here: rates are inversely proportion to both weight and height. Being taller is an advantage for the broad jump, and being heavier correlates with better bench scores.
In summary, it may be more meaningful to compare (weight x rate) for the timed drills. Furthermore, we might also stratify by height before comparing broad jumps of players or use some sort of linear transformation. Finally, bench to weight ratio may transformed to serve as a surrogate for lean muscle mass (and it's a little ridiculous that the combine doesn't track this already).
Monday, March 14, 2016
NCAA tournament projections - 2016
Selection Sunday is like the Christmas Day of College Basketball Fans. After a lot of speculating, we finally get to see where our favorite teams landed or do some statistical estimation regarding roads to the Final Four. With the bracket set yesterday, we can finally do some math!
Thanks to Ken Pomeroy we can compute a win probability for any match-up based on the teams' respective Pythagorean win percentage. In turn, using the probabilities from previous rounds, we can estimate the likelihood of a team advancing to any round once the tourney schedule is set. In theory this allows us to see the most likely winners in each slot of a potentially completed bracket.
Instead of titling by the ridiculously misleading regions, I'll just describe them by where they appear on the standard bracket (top left, top right, bottom left, bottom right) and list the probability of the team reaching the various rounds of the tournament. I advanced the favorite in each of the play-in games, but will update as that changes. Finally, use the BOLD to track the teams with the highest win probability of reaching each position:
| TOP RIGHT | Pyth | Round 1 | Sweet 16 | Elite 8 | Final 4 | Finals | Champs |
| Kansas 1 | 0.9503 | 96.9% | 75.5% | 57.4% | 37.3% | 26.0% | 15.4% |
| Austin Peay 16 | 0.3819 | 3.1% | 0.3% | 0.0% | 0.0% | 0.0% | 0.0% |
| Colorado 8 | 0.7788 | 34.9% | 6.2% | 2.3% | 0.6% | 0.2% | 0.0% |
| Connecticut 9 | 0.8677 | 65.1% | 18.0% | 9.5% | 3.8% | 1.7% | 0.6% |
| Maryland 5 | 0.8725 | 72.6% | 39.9% | 13.4% | 5.4% | 2.5% | 0.9% |
| South Dakota St. 12 | 0.7209 | 27.4% | 8.8% | 1.5% | 0.3% | 0.1% | 0.0% |
| California 4 | 0.8767 | 68.8% | 39.3% | 13.5% | 5.6% | 2.6% | 0.9% |
| Hawaii 13 | 0.7635 | 31.2% | 12.0% | 2.4% | 0.6% | 0.2% | 0.0% |
| Arizona 6 | 0.8927 | 90.8% | 48.8% | 21.6% | 9.0% | 4.6% | 1.8% |
| Wichita St 11 | 0.4579 | 9.2% | 1.2% | 0.1% | 0.0% | 0.0% | 0.0% |
| Miami FL 3 | 0.8971 | 86.7% | 47.5% | 21.6% | 9.2% | 4.8% | 1.9% |
| Buffalo 14 | 0.5727 | 13.3% | 2.4% | 0.3% | 0.0% | 0.0% | 0.0% |
| Iowa 7 | 0.8832 | 76.2% | 29.9% | 14.5% | 5.8% | 2.8% | 1.0% |
| Temple 10 | 0.703 | 23.8% | 4.5% | 1.0% | 0.2% | 0.0% | 0.0% |
| Villanova 2 | 0.9352 | 89.9% | 63.3% | 40.5% | 22.1% | 14.0% | 7.3% |
| UNC Asheville 15 | 0.6194 | 10.1% | 2.4% | 0.4% | 0.1% | 0.0% | 0.0% |
Unsurprisingly, the overall number 1 seed is the favorite (15% probability), which isn't far off from the implied probability under the 1:5 odds posted on a popular Vegas book. Indeed, this method tends to yield boring picks, like often picking the higher seed. However, it seems like there are some interesting "underdogs" to pick to the sweet 16 this year in Maryland and Arizona.
| BOTTOM LEFT | Pyth | Round 1 | Sweet 16 | Elite 8 | Final 4 | Finals | Champ |
| Oregon 1 | 0.9123 | 96.6% | 65.7% | 41.9% | 23.9% | 11.0% | 4.9% |
| Holy Cross 16 | 0.2702 | 3.4% | 0.2% | 0.0% | 0.0% | 0.0% | 0.0% |
| Saint Joseph's 8 | 0.8159 | 45.5% | 14.6% | 6.3% | 2.3% | 0.6% | 0.2% |
| Cinncinati 9 | 0.8414 | 54.5% | 19.5% | 9.3% | 3.8% | 1.2% | 0.4% |
| Baylor 5 | 0.8705 | 60.7% | 33.5% | 15.3% | 7.1% | 2.6% | 0.9% |
| Yale 12 | 0.8132 | 39.3% | 17.6% | 6.3% | 2.3% | 0.6% | 0.2% |
| Duke 4 | 0.8752 | 72.3% | 39.9% | 18.7% | 8.9% | 3.3% | 1.2% |
| UNC Wilmington 13 | 0.729 | 27.7% | 9.0% | 2.3% | 0.6% | 0.1% | 0.0% |
| Texas 6 | 0.8487 | 68.1% | 31.7% | 13.6% | 5.9% | 1.9% | 0.6% |
| Northern Iowa 11 | 0.724 | 31.9% | 9.6% | 2.6% | 0.7% | 0.1% | 0.0% |
| Texas A&M 3 | 0.8923 | 83.6% | 54.2% | 28.2% | 14.9% | 6.1% | 2.4% |
| Green Bay 14 | 0.619 | 16.4% | 4.5% | 0.9% | 0.2% | 0.0% | 0.0% |
| Oregon St. 7 | 0.7691 | 41.3% | 11.8% | 4.2% | 1.3% | 0.3% | 0.1% |
| VCU 10 | 0.8259 | 58.7% | 20.9% | 9.1% | 3.6% | 1.0% | 0.3% |
| Oklahoma 2 | 0.9199 | 83.8% | 61.6% | 39.8% | 24.1% | 11.7% | 5.5% |
| Cal St. Bakersfield 15 | 0.6902 | 16.2% | 5.7% | 1.6% | 0.4% | 0.1% | 0.0% |
To comment on interesting upsets, it looks like VCU should beat Oregon state this year. If you're the type of person who always picks a 5-12 upset, Yale seems the better bet to upset (~40% win probability, UPDATE, they just beat Baylor...statistics, baby!). Finally, while Texas A&M would have been a nice sleeper here, the stronger Oklahoma looks poised to make a run to the final 4, provided they can edge out Oregon what looks to be a coin flip of a game (UPDATE: Holy Cross Victory makes slightly easier path for Oregon, giving them a small edge now over Oklahoma).
| Team | Pyth | Round 1 | Sweet 16 | Elite 8 | Final 4 | Finals | Champ |
| North Carolina 1 | 0.9407 | 94.7% | 75.9% | 48.0% | 32.1% | 17.5% | 10.2% |
| Florida Gulf Coast 16 | 0.4686 | 5.3% | 1.0% | 0.1% | 0.0% | 0.0% | 0.0% |
| USC 8 | 0.7946 | 49.3% | 11.3% | 3.5% | 1.2% | 0.3% | 0.1% |
| Providence 9 | 0.7991 | 50.7% | 11.8% | 3.7% | 1.3% | 0.3% | 0.1% |
| Indiana 5 | 0.8959 | 81.9% | 40.0% | 17.4% | 9.2% | 3.7% | 1.6% |
| Chattanooga 12 | 0.6557 | 18.1% | 3.5% | 0.6% | 0.1% | 0.0% | 0.0% |
| Kentucky 4 | 0.9198 | 83.2% | 51.9% | 25.9% | 15.4% | 7.2% | 3.7% |
| Stony Brook 13 | 0.6979 | 16.8% | 4.6% | 0.9% | 0.2% | 0.0% | 0.0% |
| Notre Dame 6 | 0.8131 | 55.4% | 17.9% | 7.3% | 2.1% | 0.5% | 0.2% |
| Michigan 11 | 0.7778 | 44.6% | 12.4% | 4.5% | 1.1% | 0.2% | 0.1% |
| West Virginia 3 | 0.9236 | 70.1% | 52.8% | 34.4% | 17.5% | 8.4% | 4.4% |
| Stephen F. Austin 14 | 0.8378 | 29.9% | 17.0% | 7.6% | 2.4% | 0.7% | 0.2% |
| Wisconsin 7 | 0.839 | 56.2% | 24.6% | 10.2% | 3.2% | 1.0% | 0.3% |
| Pittsburgh 10 | 0.8024 | 43.8% | 16.7% | 6.0% | 1.6% | 0.4% | 0.1% |
| Xavier 2 | 0.8946 | 86.4% | 55.7% | 29.5% | 12.5% | 5.0% | 2.2% |
| Weber State 15 | 0.5717 | 13.6% | 3.0% | 0.5% | 0.1% | 0.0% | 0.0% |
With the exception of West Virginia to the Elite 8, there's not much excitement here.
| BOTTOM RIGHT | Pyth | Round 1 | Sweet 16 | Elite 8 | Final 4 | Finals | Champ |
| Virginia 1 | 0.9482 | 97.0% | 78.5% | 54.9% | 34.5% | 21.6% | 13.3% |
| Hampton 16 | 0.3639 | 3.0% | 0.4% | 0.0% | 0.0% | 0.0% | 0.0% |
| Texas Tech 8 | 0.8096 | 49.5% | 10.4% | 3.7% | 1.1% | 0.3% | 0.1% |
| Butler 9 | 0.8129 | 50.5% | 10.8% | 3.9% | 1.2% | 0.4% | 0.1% |
| Purdue 5 | 0.9078 | 71.4% | 43.1% | 18.3% | 8.9% | 4.3% | 2.0% |
| Arkansas Little Rock 12 | 0.7978 | 28.6% | 11.2% | 2.7% | 0.8% | 0.2% | 0.1% |
| Iowa State 4 | 0.8919 | 75.2% | 39.0% | 15.1% | 6.7% | 2.9% | 1.3% |
| Iona 13 | 0.731 | 24.8% | 6.7% | 1.3% | 0.3% | 0.1% | 0.0% |
| Seton Hall 6 | 0.8674 | 51.4% | 30.2% | 11.1% | 3.9% | 1.5% | 0.6% |
| Gonzaga 11 | 0.8609 | 48.6% | 27.9% | 9.9% | 3.4% | 1.3% | 0.5% |
| Utah 3 | 0.8547 | 75.2% | 36.1% | 12.5% | 4.2% | 1.5% | 0.5% |
| Fresno State 14 | 0.6595 | 24.8% | 5.8% | 0.9% | 0.1% | 0.0% | 0.0% |
| Dayton 7 | 0.7806 | 45.3% | 9.7% | 3.7% | 0.9% | 0.2% | 0.1% |
| Syracuse 10 | 0.8111 | 54.7% | 13.3% | 5.7% | 1.5% | 0.5% | 0.1% |
| Michigan State 2 | 0.945 | 92.2% | 74.9% | 55.8% | 32.3% | 19.7% | 11.9% |
| Middle Tennessee 15 | 0.5926 | 7.8% | 2.1% | 0.4% | 0.1% | 0.0% | 0.0% |
Looks like Virginia is the favorite to match-up against Kansas in the finals, and we have two interesting picks in Syracuse over Dayton in the opening round and Purdue to advance to the sweet 16 (over Iowa State).
To summarize, the expected "upsets" in the opening round are all 9 seeds and two 10 seeds (Syracuse and VCU), which is pretty conservative as we're simply selecting the favorite (highest probability). Into the sweet 16, we expect Maryland, Arizona, and Purdue to win over the respective 3 and 4 seeds they're likely to match up against. West Virginia is the only surprise to the elite 8, and Oklahoma is the only possible surprise to the final 4. Bear in mind these overview estimates don't consider potential home court advantage or match-up issues, so if you have an inkling about a team because they are close to home or match up well, you are wise to deviate at your own discretion.
Subscribe to:
Posts (Atom)